format_continuous_cognigen can be passed to the labels argument
of scale_*_continuous functions to format continuous values.
major_breaks_log and minor_breaks_log can be passed to
breaks and minor_breaks in scale_* functions to format
log10 axis scales, respectively.
format_continuous_cognigen(x)

major_breaks_log(x)

minor_breaks_log(x)Value
either a numeric or expression vector the same length
as x
Examples
library(ggplot2)
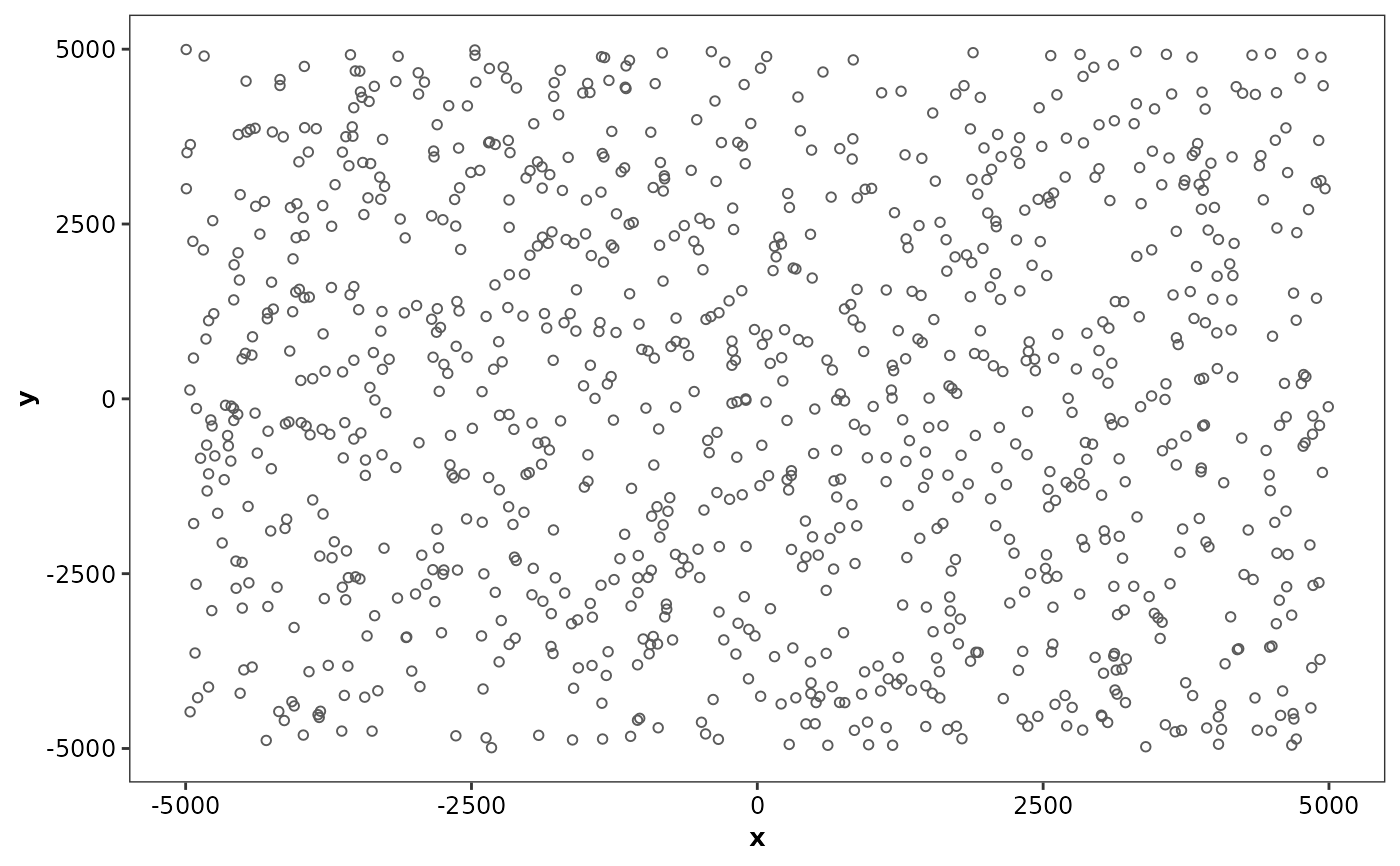
min <- -5000
max <- 5000
set.seed(123)
data <- data.frame(
x = runif(1000, min, max),
y = runif(1000, min, max)
)
ggplot(data, aes(x = x, y = y)) +
geom_point() +
scale_y_continuous(labels = format_continuous_cognigen)
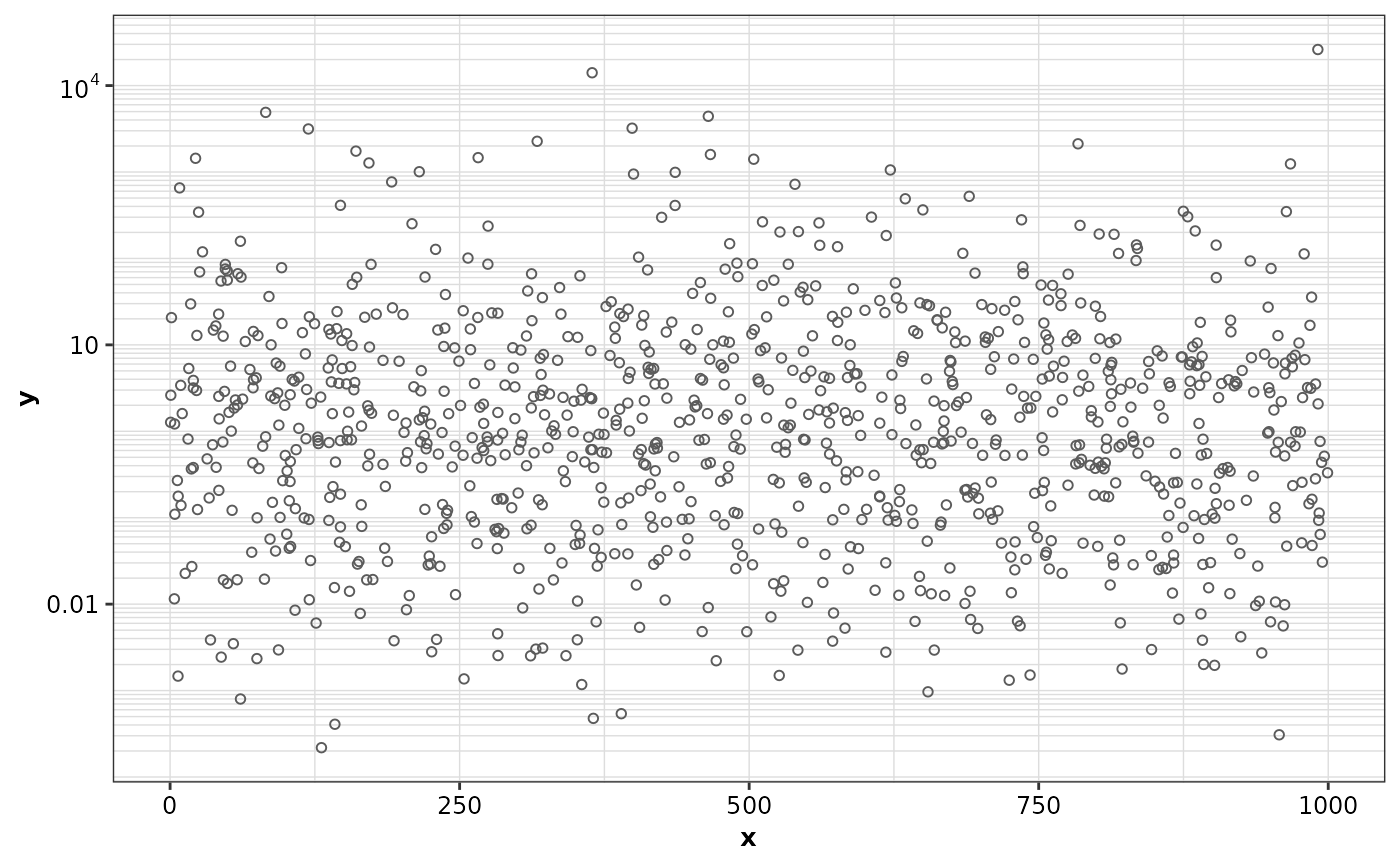
 min <- 0
max.x <- 1000
max.y <- 3
set.seed(123)
data <- data.frame(
x = runif(1000, min, max.x),
y = rlnorm(1000, min, max.y)
)
ggplot(data, aes(x = x, y = y)) +
geom_point() +
theme_cognigen_grid(minor.x = TRUE, minor.y = TRUE) +
scale_y_log10(minor_breaks = minor_breaks_log, labels = format_continuous_cognigen)
min <- 0
max.x <- 1000
max.y <- 3
set.seed(123)
data <- data.frame(
x = runif(1000, min, max.x),
y = rlnorm(1000, min, max.y)
)
ggplot(data, aes(x = x, y = y)) +
geom_point() +
theme_cognigen_grid(minor.x = TRUE, minor.y = TRUE) +
scale_y_log10(minor_breaks = minor_breaks_log, labels = format_continuous_cognigen)